

Yelena Dobric
Yelena Dobric
Behavioral & Predictive Analysis, for Financial Advisors - with IBM Watson
Client: BNY Mellon Pershing, investments division
Situation:
NetX360 is a platform for Financial Advisors. It has been around for 10 years. Now Pershing partnered with IBM to enhance existing NetX360 analytics, with Watson AI solution.
There was already a functional prototype, when I joined this project, but it did not have UX help.AI predicts or calculates the following:
1. Possible client attrition
2. Predicts upcoming life events
3. Identifies client segments
4. Surfaces top action clients by aggregating attrition with other life events. Client can have multiple life events associated with them.
Team:
On client's side, a Product Manager, Business Analyst, Project Manager, Front-End Developer and myself as a UX resource. On the IBM side, we partnered with Head of R&D, and IBM's branding team.
Personas:
Financial Advisors who use Pershing's NetX360 platform.
Task:
To utilize AI to help financial advisors, do their job better, with more sophisticated information at hand, to:
● Better manage risk
● Better manage their time
● Spot opportunities to grow business
Challenge:
In 2017, when I worked on this, AI was an unpaved territory. We did not know how much we can customize APIs, what info can we surface, and what info and what amount of it, will be enough to engage users.Action:
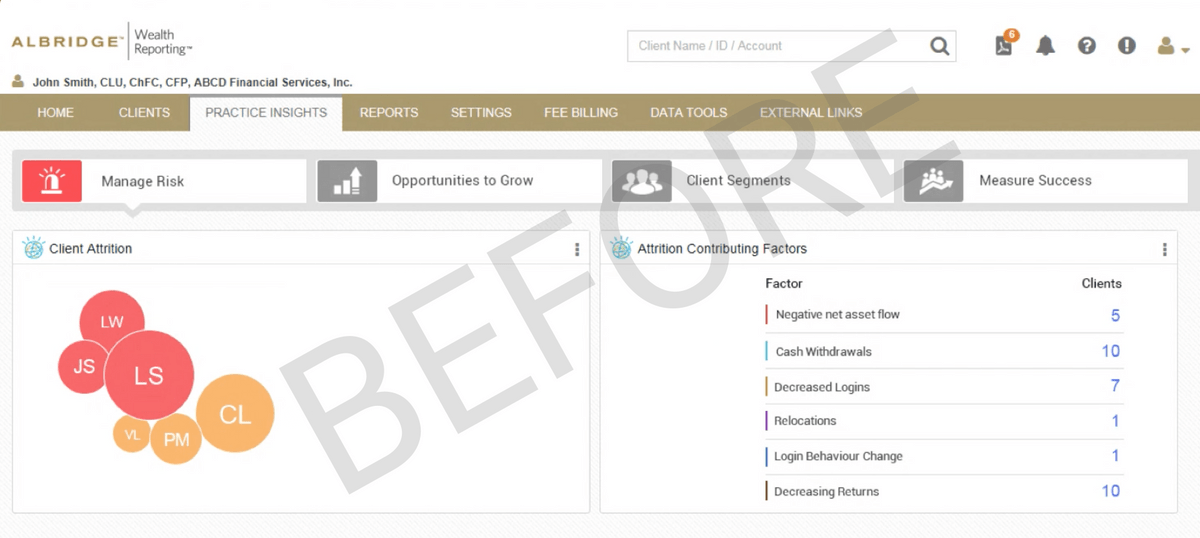
I did heuristic evaluation, and came up with the list of UX improvements. See "before me" and "after me" visuals below.
My role (see explained in the visual below)
● Added context
● Established trust
● Translated machine into human language
● Provided interaction design and data visualization
Result:
● UX improvements were received favorably by Financial Advisors, and increased adoption by 25%.
● IBM (vendor) was replaced after 2 years, but the product remained. The new vendor provided above 50% accuracy, with Attrition Risk.
● Life Events proved very helpful. Segment strategy eliminated Rising Stars, but performed well with the other two segments.
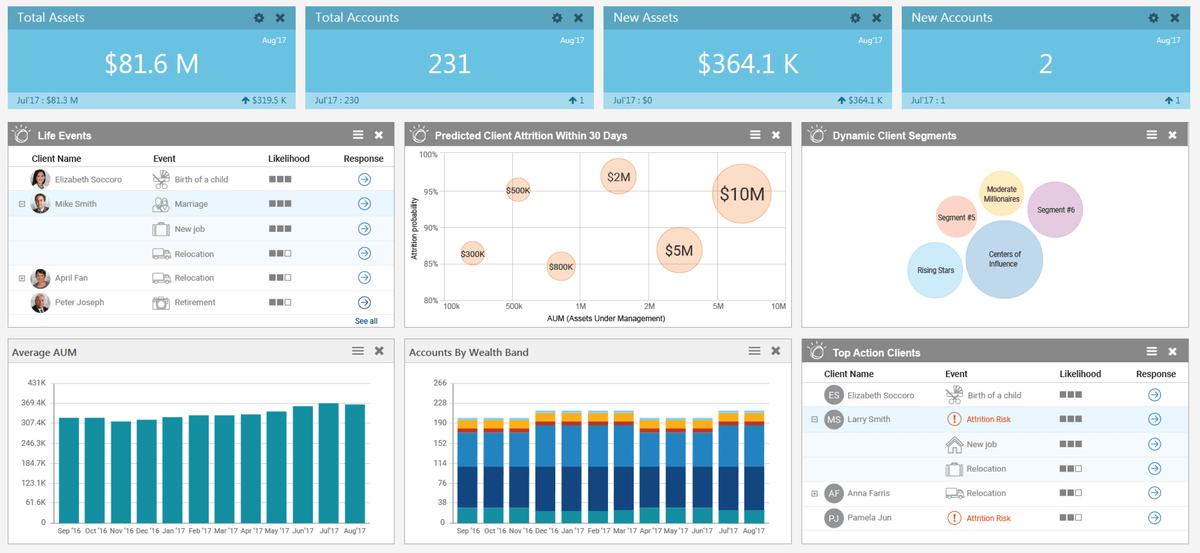
And AFTER
My role:
● Added context, by adding elements to chart: timeframe for Attrition, X and Y axises, and labels on them. Answer the question: what is this and why should I care?
● Established trust, by adding the "Confidence score" of 80% in Attrition predictions, and adding "Likelihood" feature, to Life Events.
● Translated machine into human language by surfacing AUM, on potential departing clients. “Show me the money” concept.
● Provided interaction design and data visualization. Provided flow: dashboard, detailed view. Break data into chunks. User cannot process all at once.
Client Attrition
Goal is for FAs to be more efficient:
1. Prevent clients from leaving his or her practice
2. Identify high touch-low profit clients, and if needed, make some tough decisions
Highest AUM client is selected by default. If client bubbles overlap, higher AUM is on top. User clicks on another bubble, to change selection.
• AUM (assets under management) is on the bubbles. That way advisors knows how much resources they stand to loose, if they loose the client.
"Show me the money" - that's human language.• Chart header tells user the timeframe. Providing the timeframe "within the next 30 days" adds a sense of urgency.
• "X" and "Y" axis put bubbles in perspective.
• We only showed high probability; 80% and above.
Hamburger icon on each widget has the option to "Enlarge" widget. That means a single widget takes over the dashboard widgets' area.
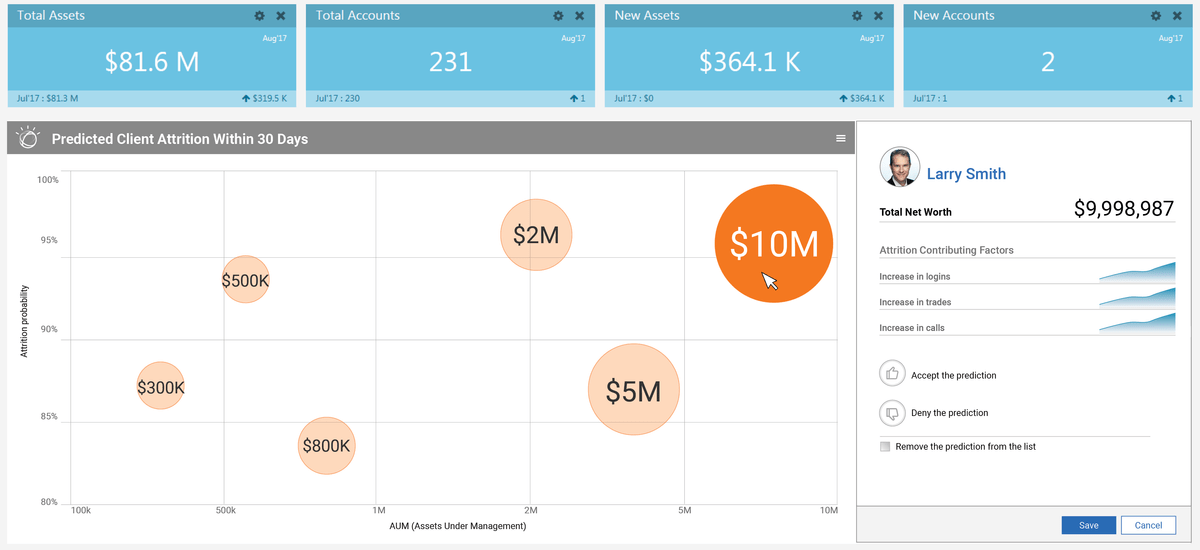
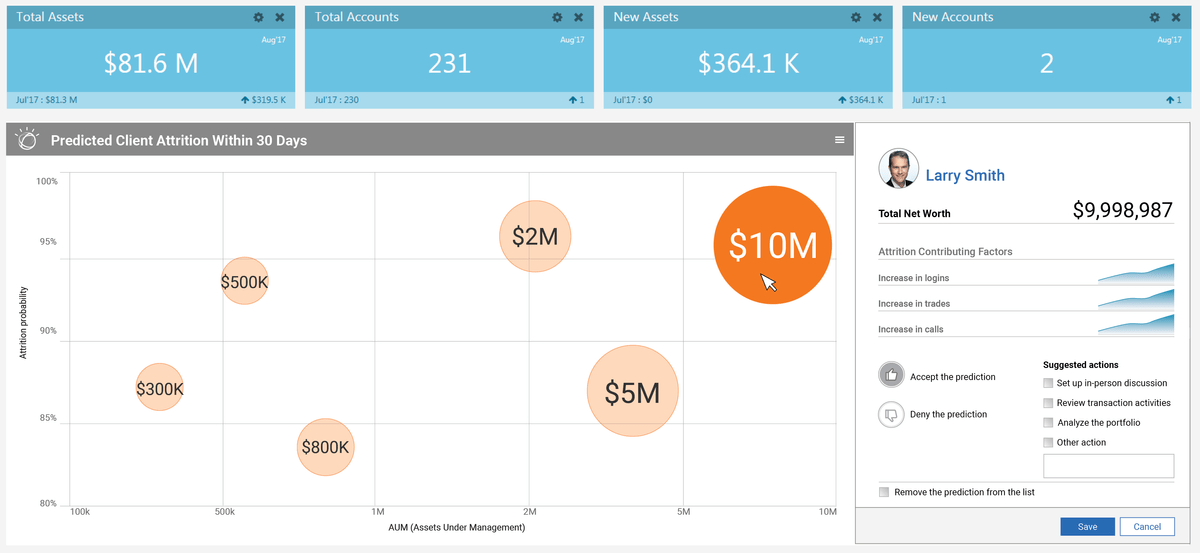
If a user "Accepts" the prediction, they are presented with suggested actions. If they "Deny", nothing happens, but they do have an option to "Remove the prediction from the list".
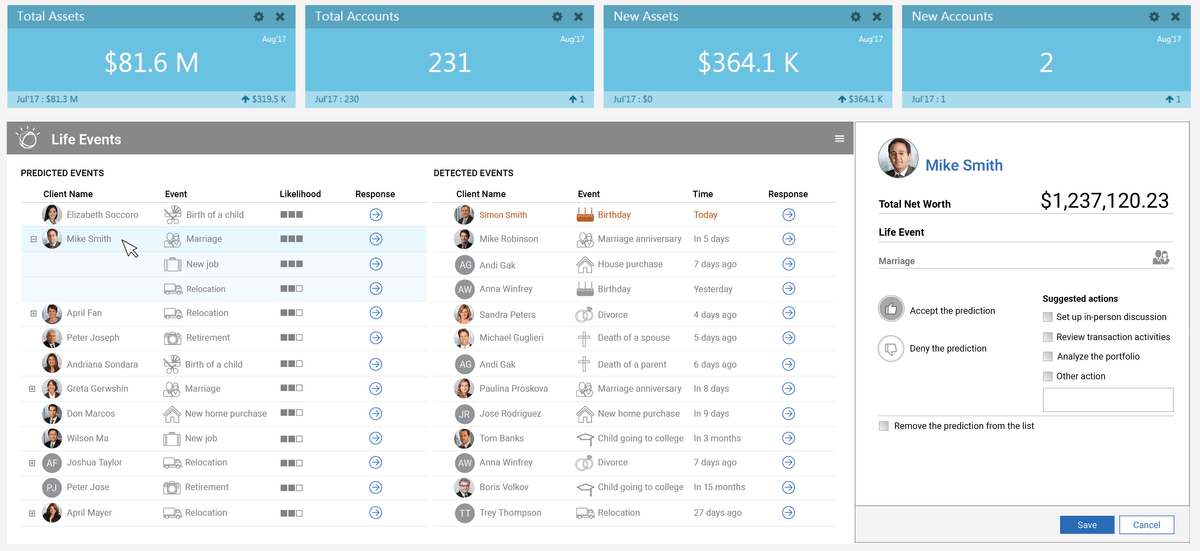
"Life Events"
"Life Event" serve to strengthen client relationships, and gives FAs heads up, on important forces influencing their clients' lives.
Events can be definite, such as birthdays, anniversaries (work or marriage), and they can be predicted, such as relocation, new job, house purchase, etc. For example, if a client got married and purchased a home, a child may be under way, so an FA may suggest some 529 plans for client to review.
• I used icons for life events, because human brain recognizes pictorial symbols 10 times faster then textual ones. And again, user would create a mental model for life event icons, and we can just use the icon, on mobile.
• I also suggested "Likelihood" category be added, to put predictions in perspective for users (financial advisors). It's a familiar pattern, like a ratings on IMDB or Amazon.
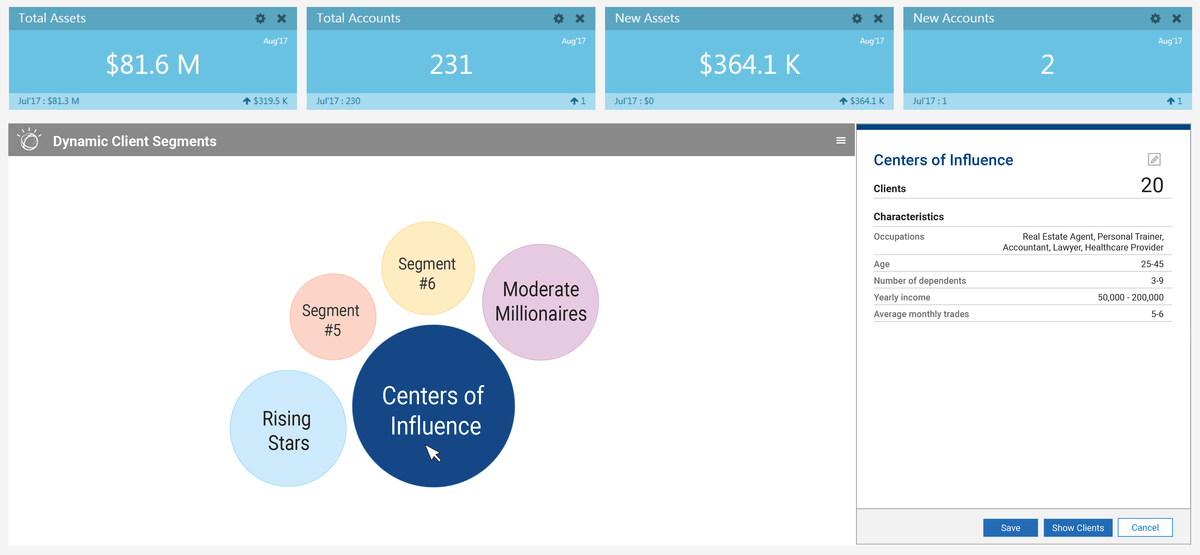
Client Segments
In MVP, segments are "off the shelf". User cannot create their own segments.
Largest segment is selected by default. If a user clicks on another bubble, they see that cohort's characteristics.
Centers of Influence: individuals with large networks, such as doctors, lawyers and personal trainers.
Moderate Millioners: High Earners Not Rich Yet, in Wealth Management industry known as HENRYs. Those individuals FA wants to keep and eye on, and keep close to the vest. Life Events prediction is helpful here, too.
Rising Stars: individuals whose occupations are expected to see significant demand in upcoming years, such as nurses, data analysts and software developers.
In 2nd iteration of this product, users will be able to create their own segments. And if they realize they have a significant chunk of certain cohort, adapt their offering, to maximize their efficiency. Those cohorts may be:
Women: FAs and their employers need to adapt their investment strategy, and approach to clients. Women have different financial needs and life paths, and it has been proven that women invest differently than men. For more information on that, I wrote a white paper on the topic. See my LinkedIn, or this tab.
Millenials: Advisories may want to beef up their digital presence and experience: website, mobile app, voice agent, etc. And add Socially Responsible Investments to their offering.
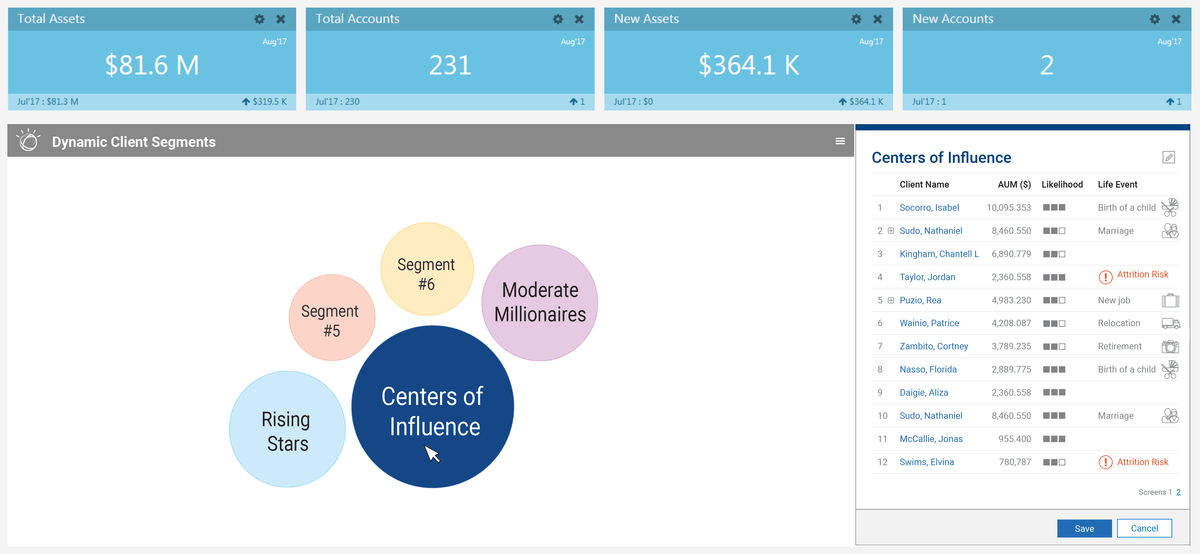
If user clicks on "Show Clients", in the previous slide, they get the full list of names, in the same panel, with options to:
1. Learn more about individuals in this segment, such as upcoming life events, which can serve as a reason to get in touch.
2. Click on a client's name, to go to "Client Profile" page.
Below is the project in Production. Video is 1:05 minutes long. No sound.
Visual design is unfavorable, but please try to focus on content. Interaction is a generation behind the wireframes above.


